Freedom House
A long-term partnership with the nation's leading watchdog for global democracy.
Where we started.
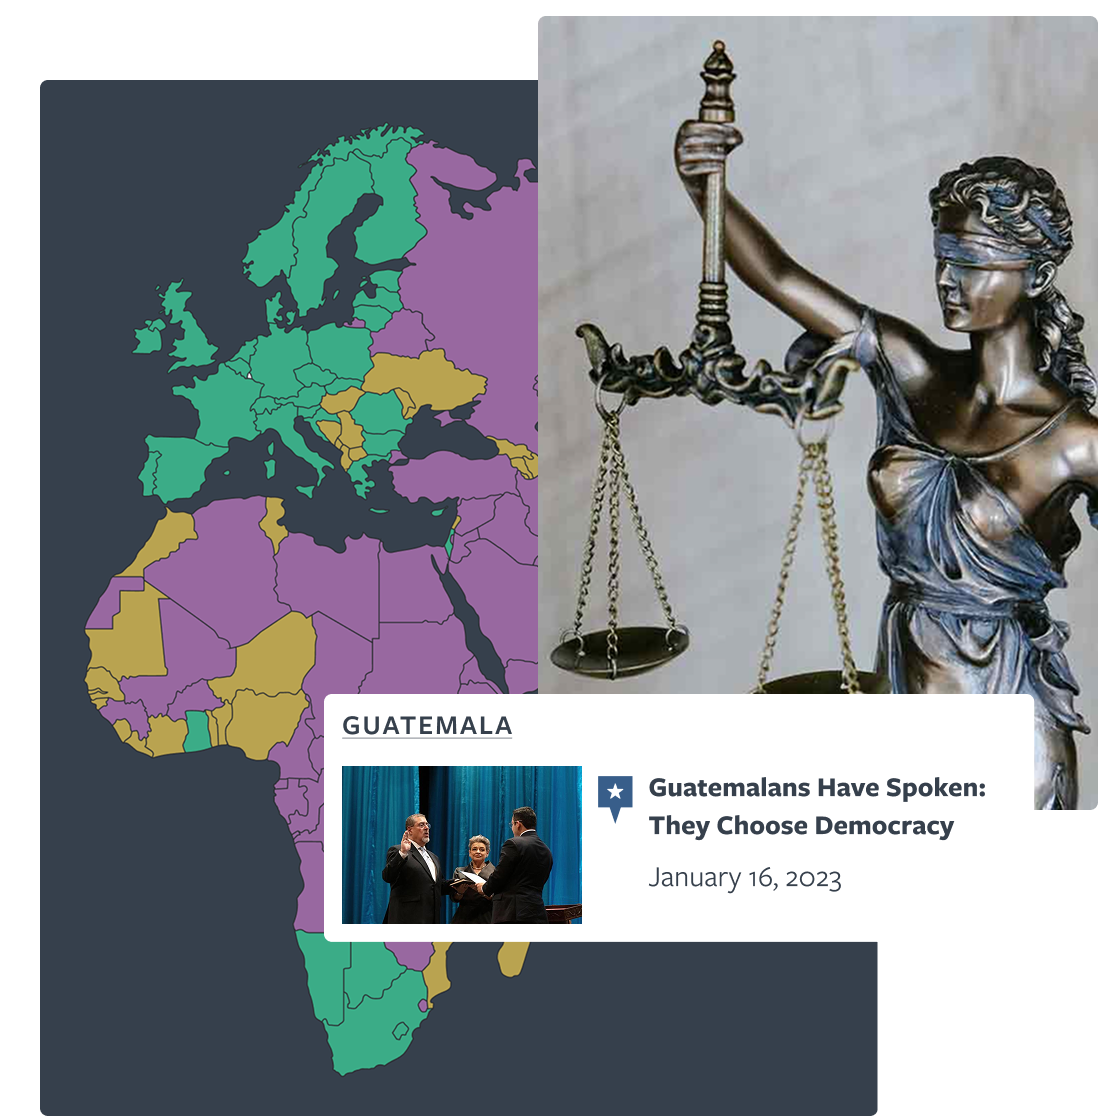
Freedom House is a nonprofit founded on the core conviction that freedom flourishes in democratic nations where governments are accountable to their people; the rule of law prevails; and freedoms of expression, association, and belief, as well as respect for the rights of women, minorities, and historically marginalized groups, are guaranteed.
We began our partnership with Freedom House in 2019 on a website redesign.
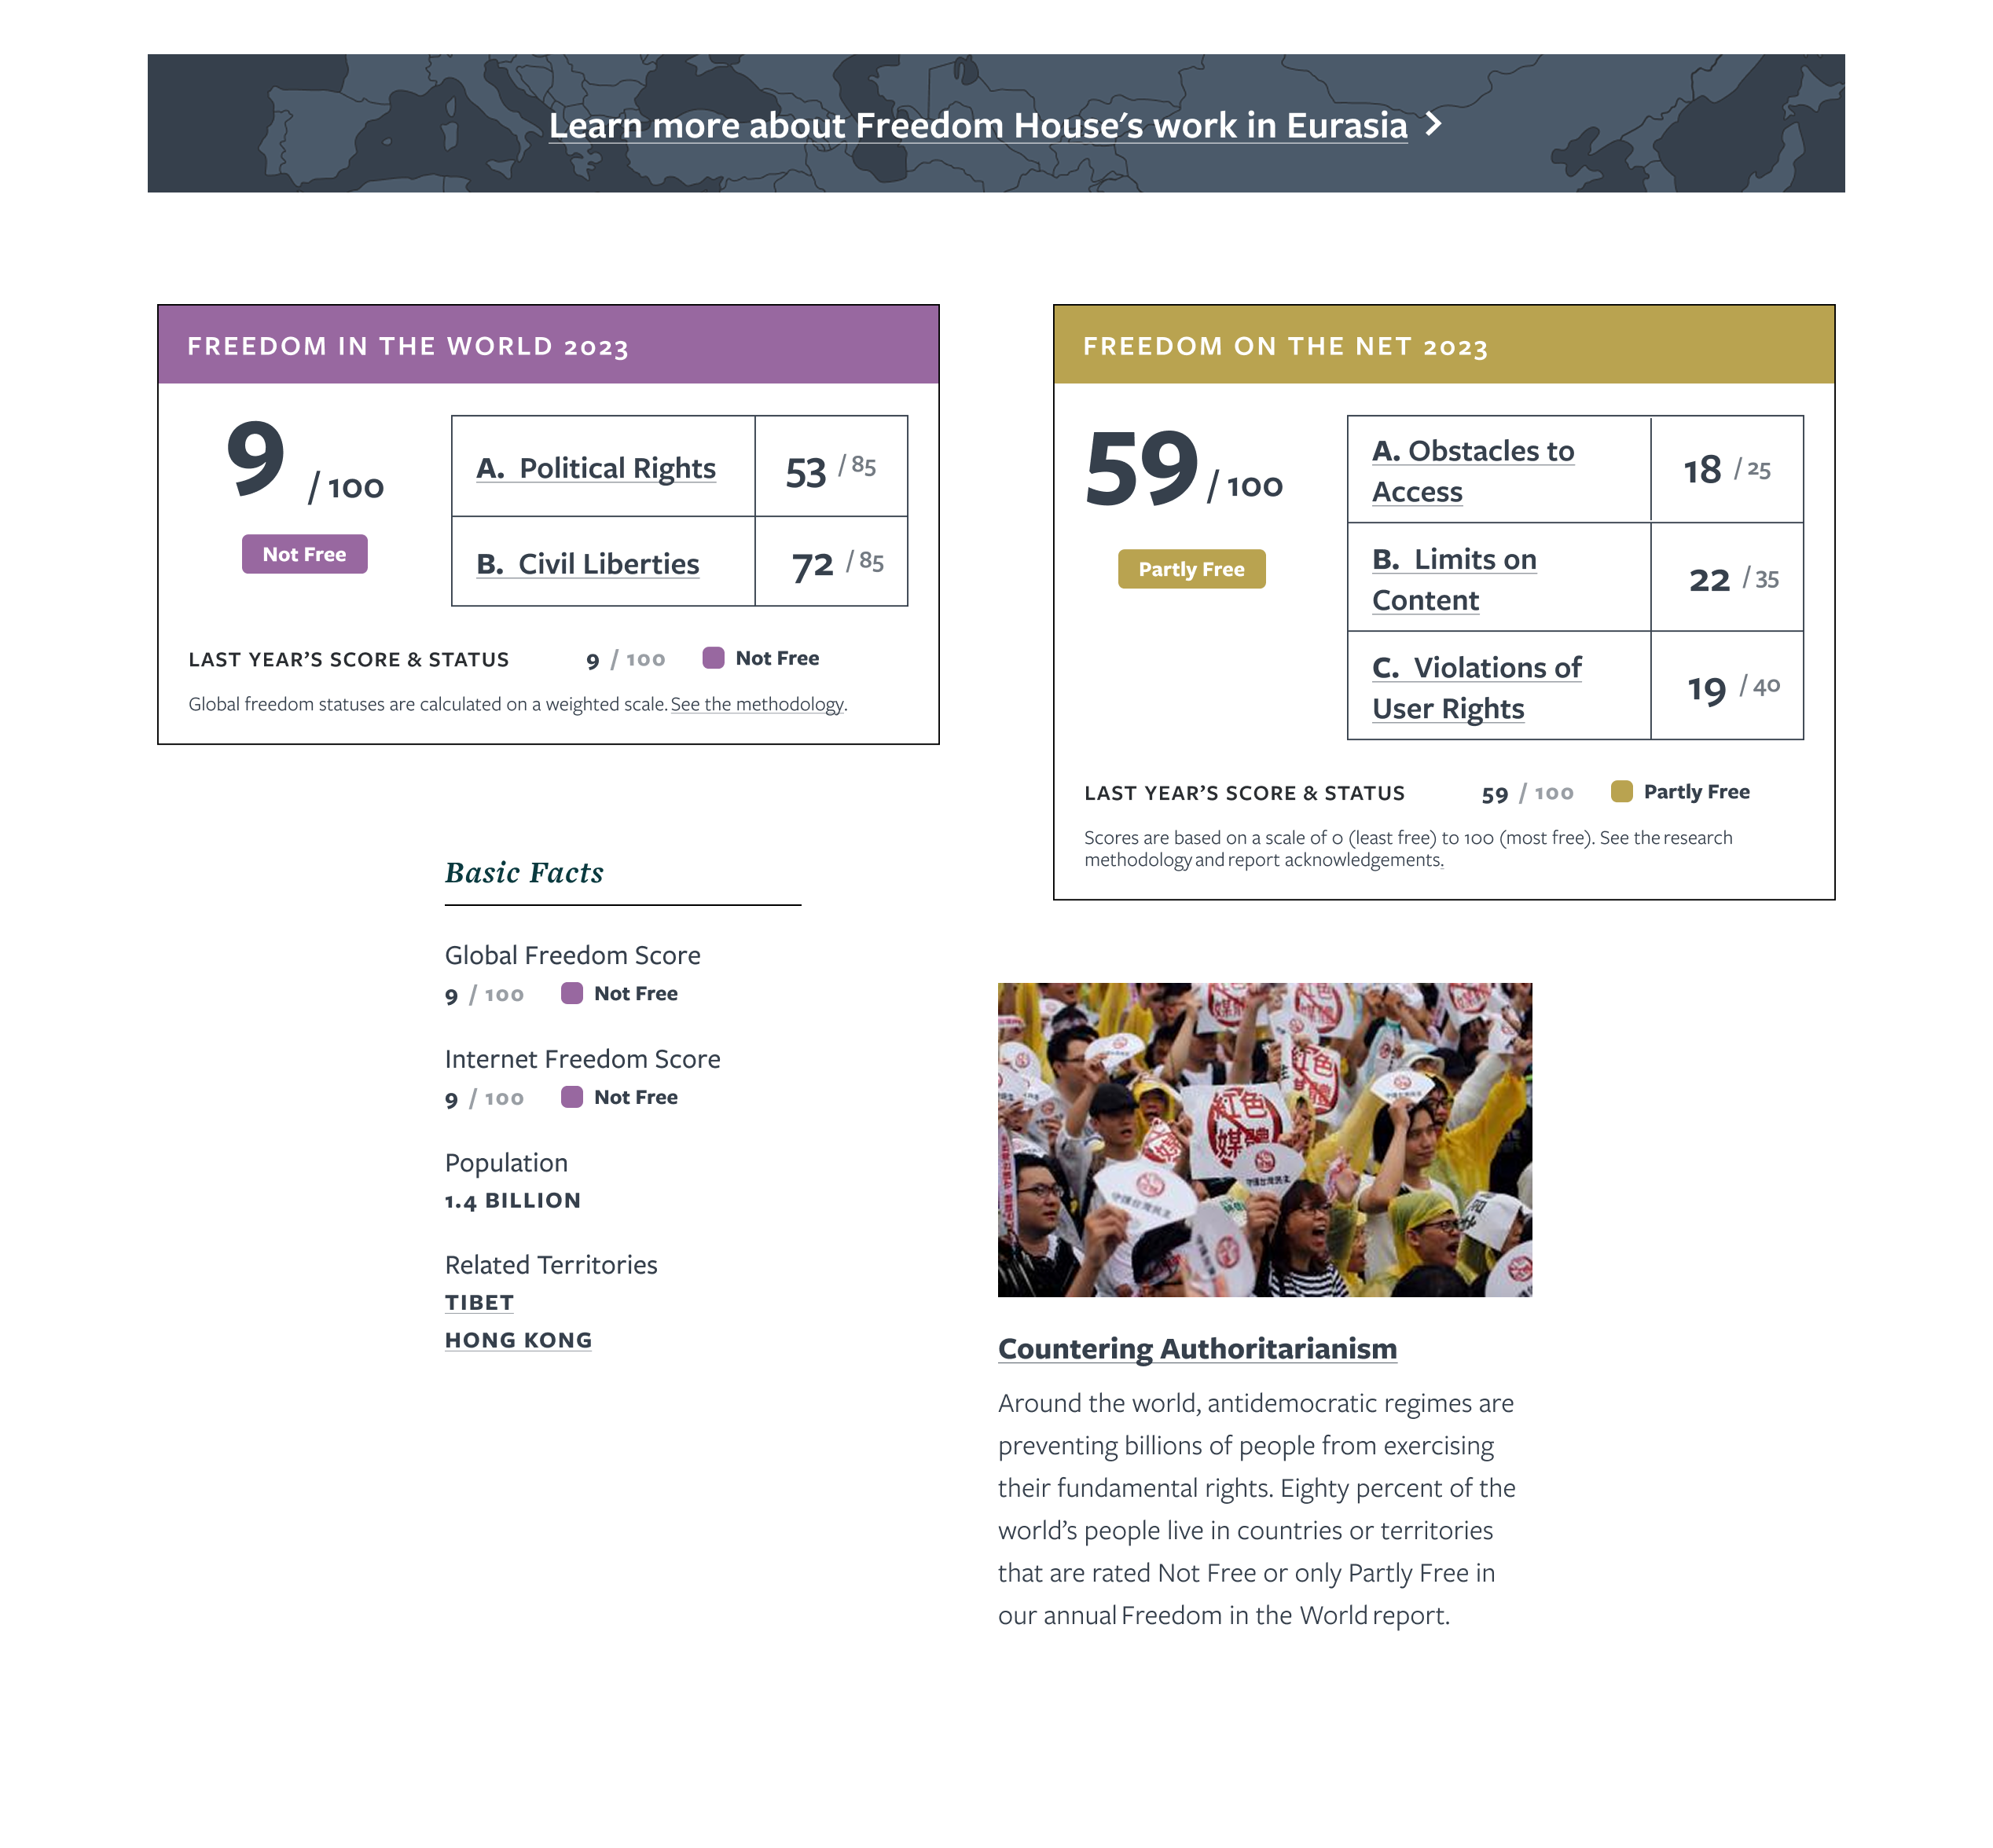
Website Redesign: Balancing narrative and data.
Freedom House’s research team compiles data that has the potential to shine a spotlight on nations with eroding democracies and protect freedom, but their aging website lacked the capacity and flexibility to leverage that data to tell the powerful stories needed to make change.
The initial task was to organize Freedom House’s vast archive of content into a concise, easy-to-navigate information architecture, categorizing all of their content by issue, country, and policy.
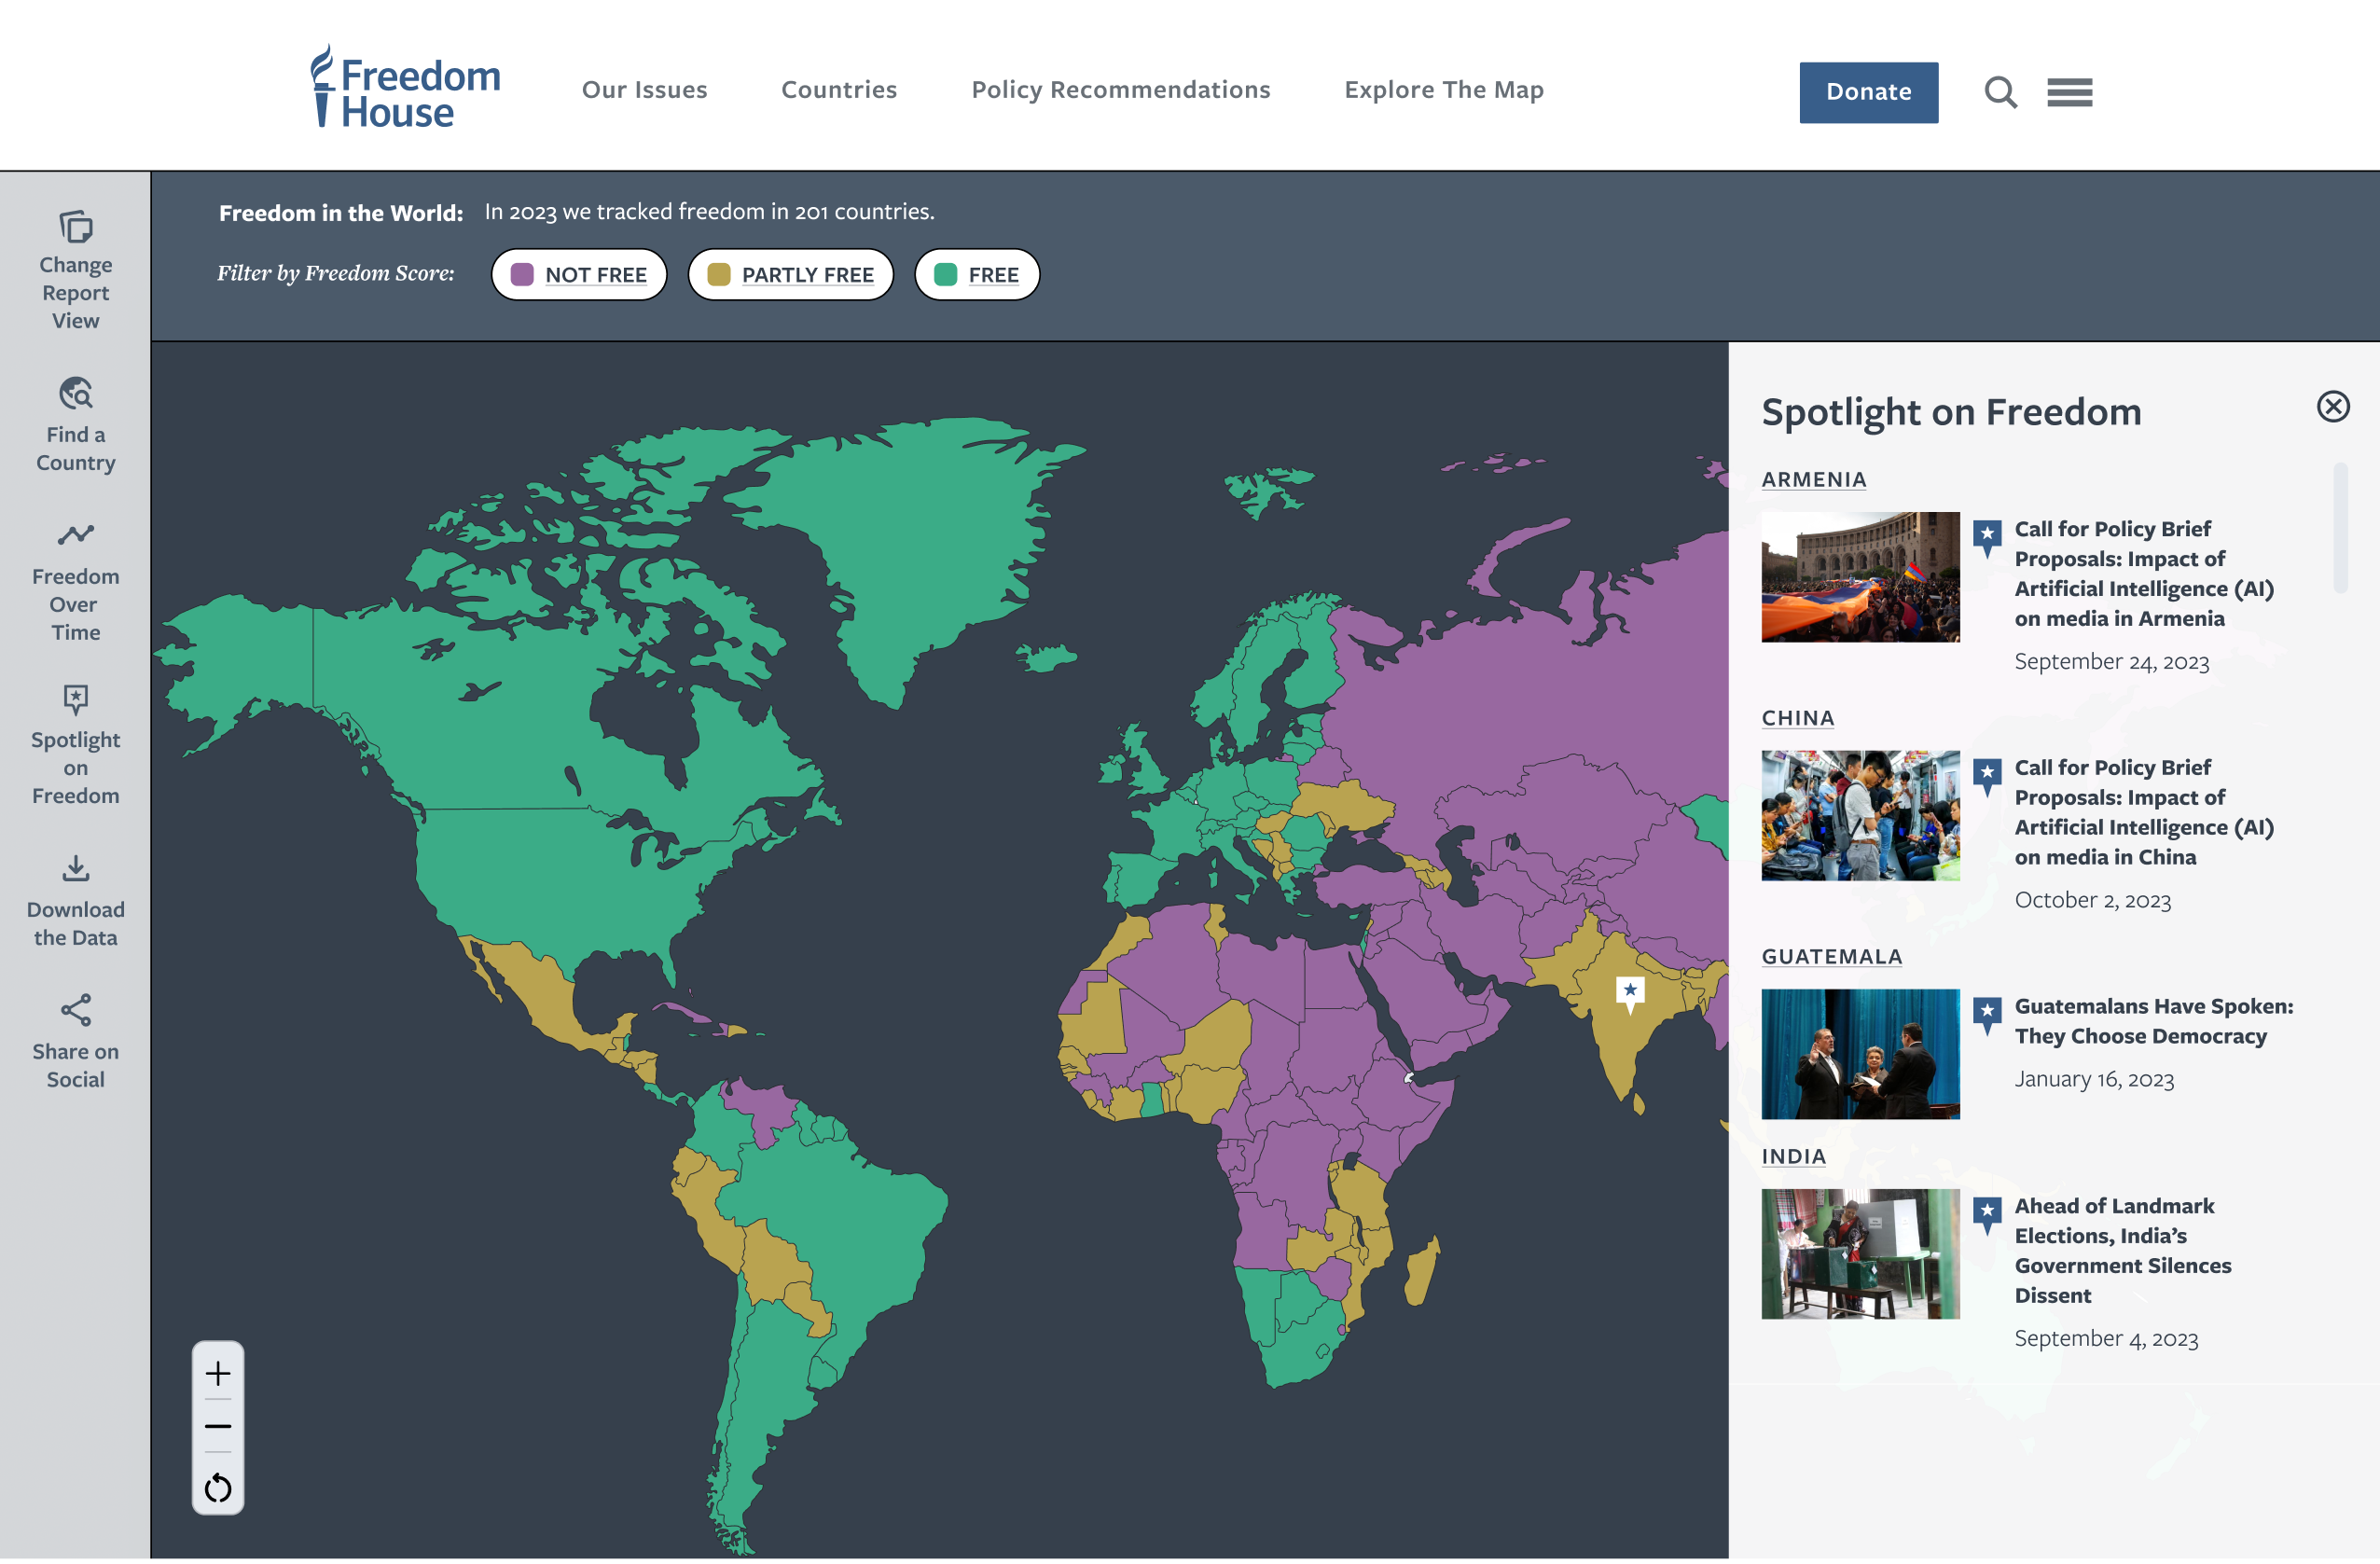
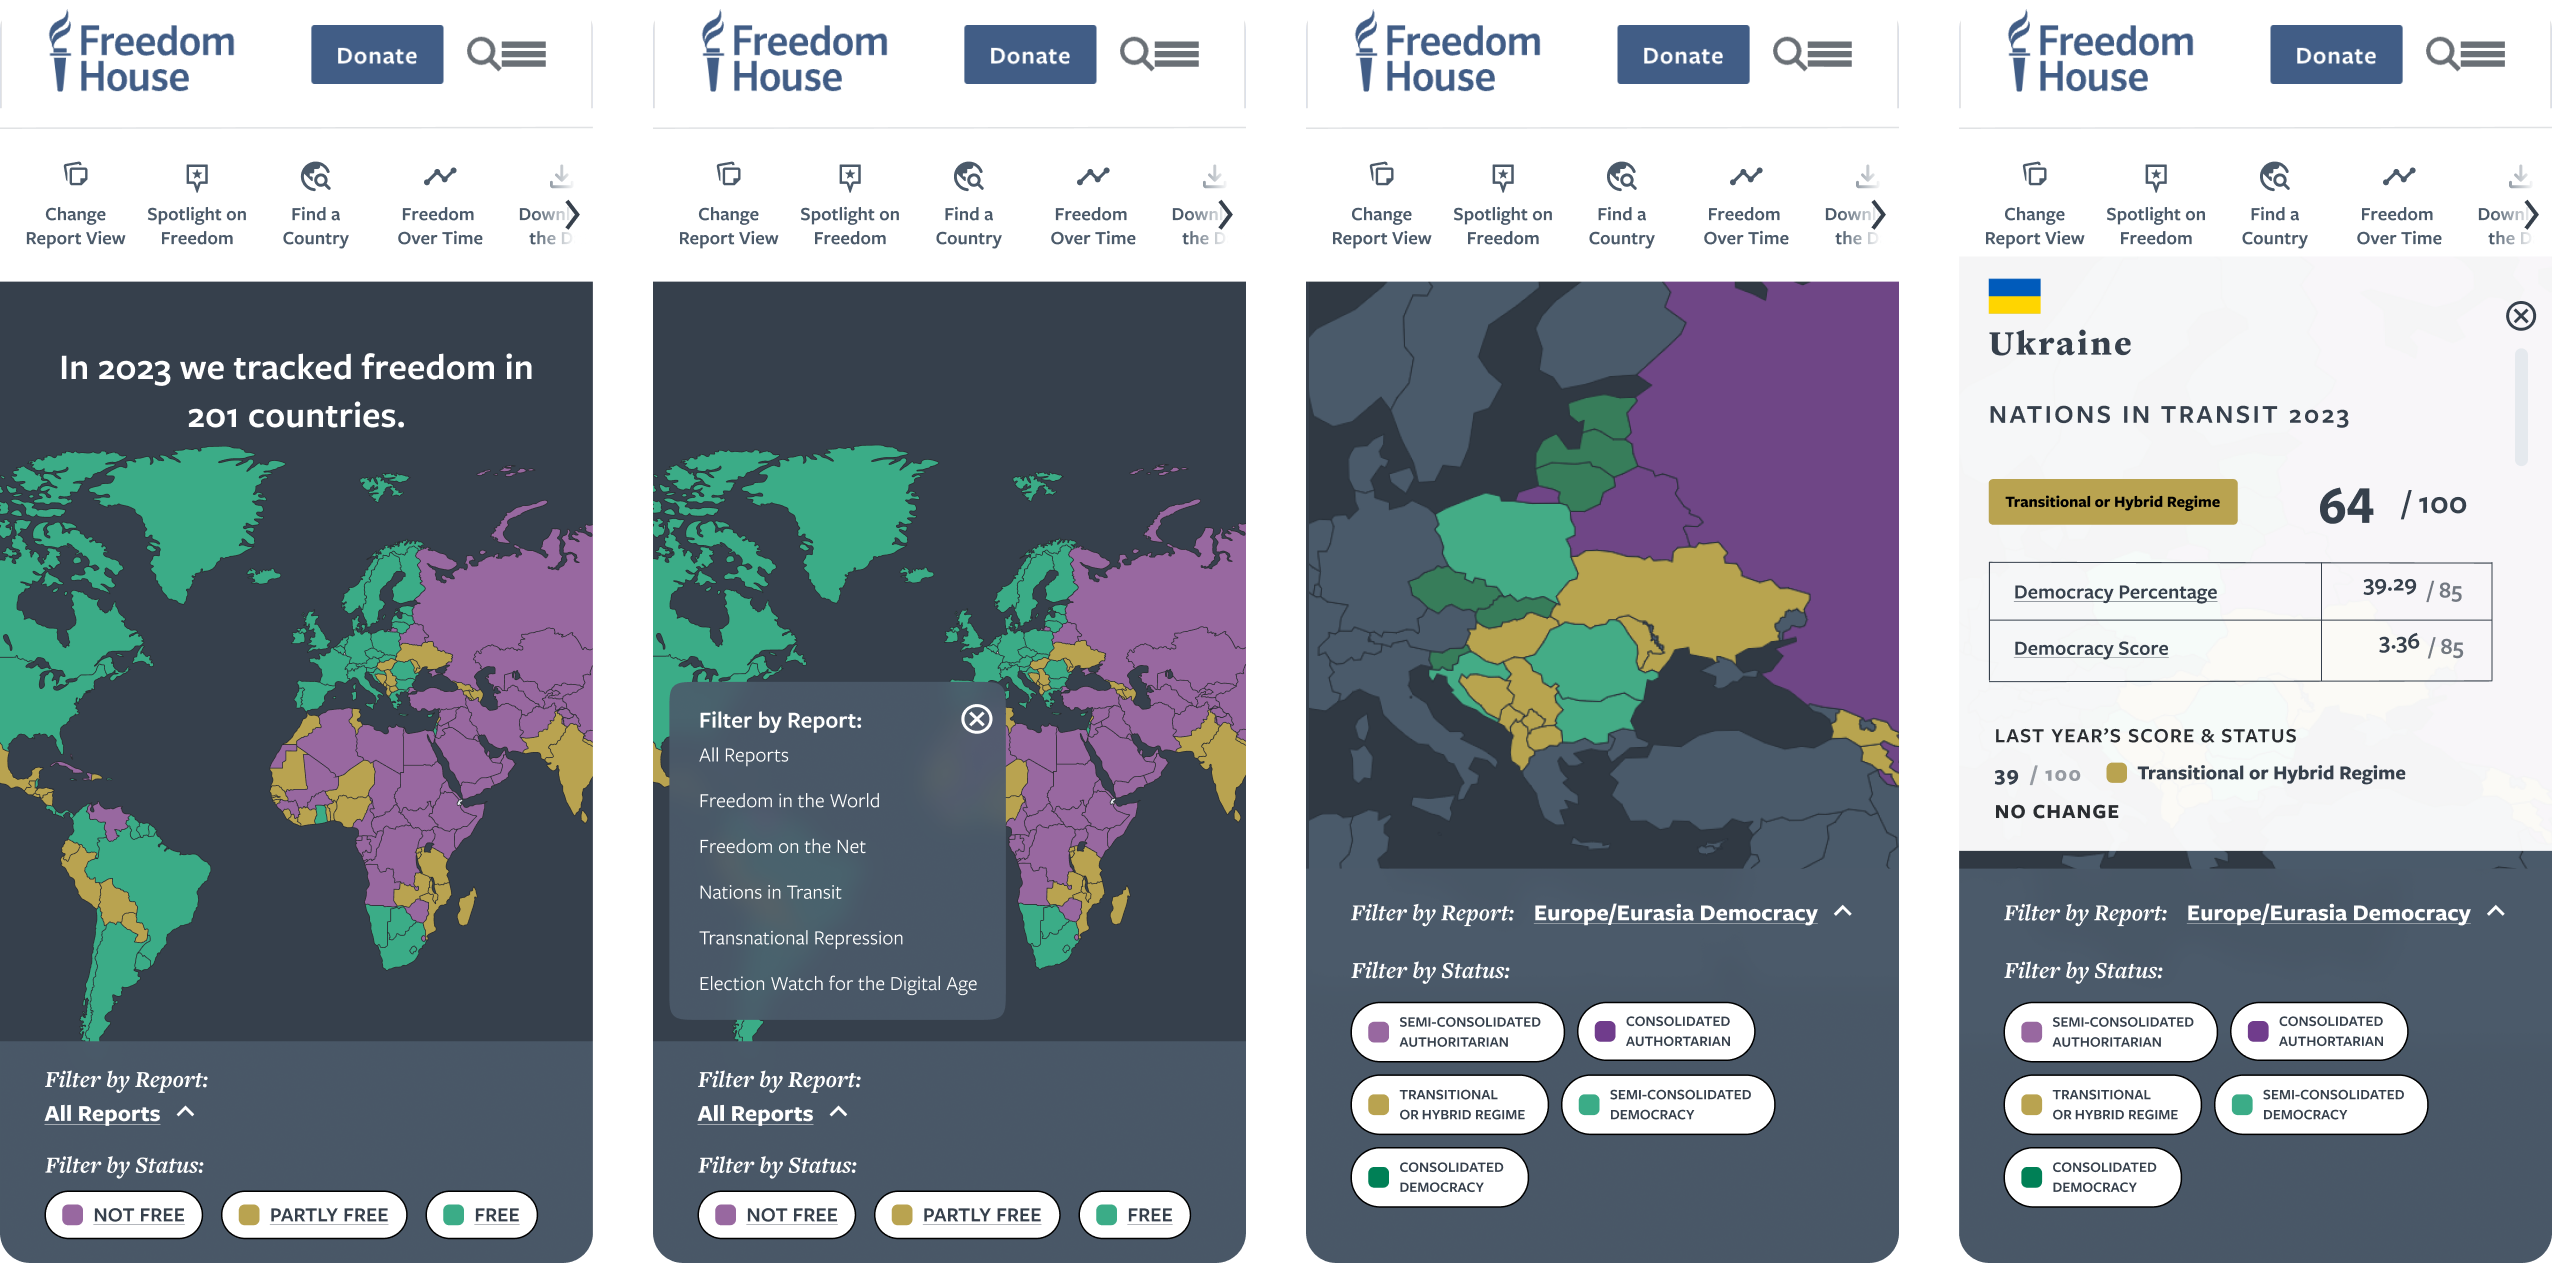
Given Freedom House’s global focus, we created a unified map-based interactive visualization that combined key data attributes across reports, decades, topics, and trends. The map tells an immediate, powerful story about the state of democratic, digital, and press freedoms in every nation.
Since site launch, we’ve continued to partner with Freedom House on website support. Underlying all of our support projects is a strategy based on shifting Freedom House’s website to a real-time source of truth for the state of democracy. We wanted to refresh high-impact pages to make their day-to-day and month-to-month work more visible, past annual reports.
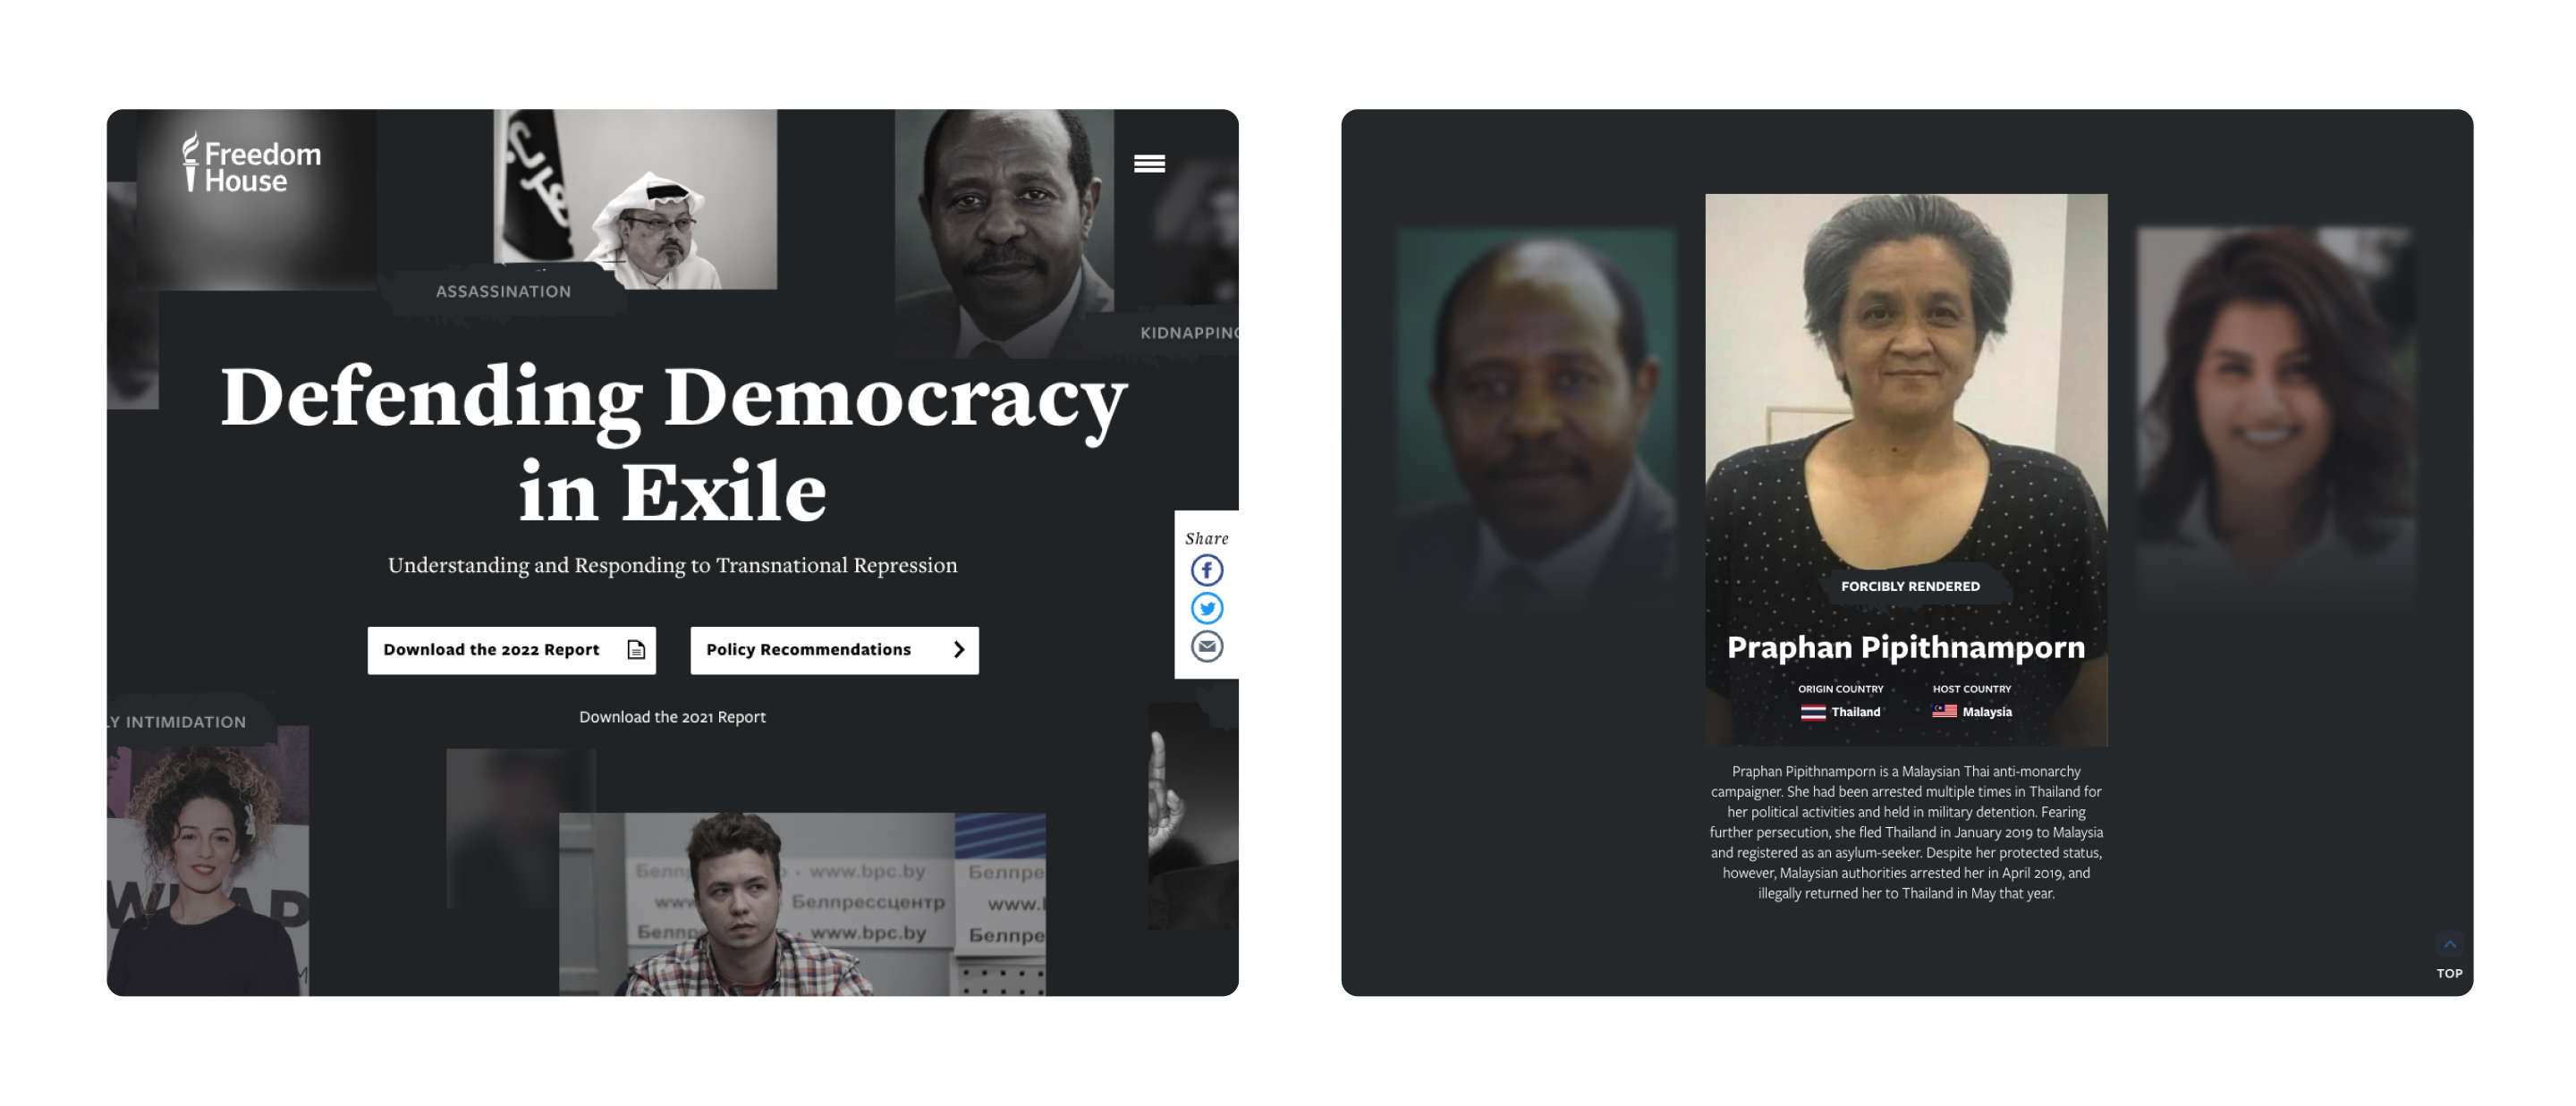
Ongoing Support: Transnational Repression.
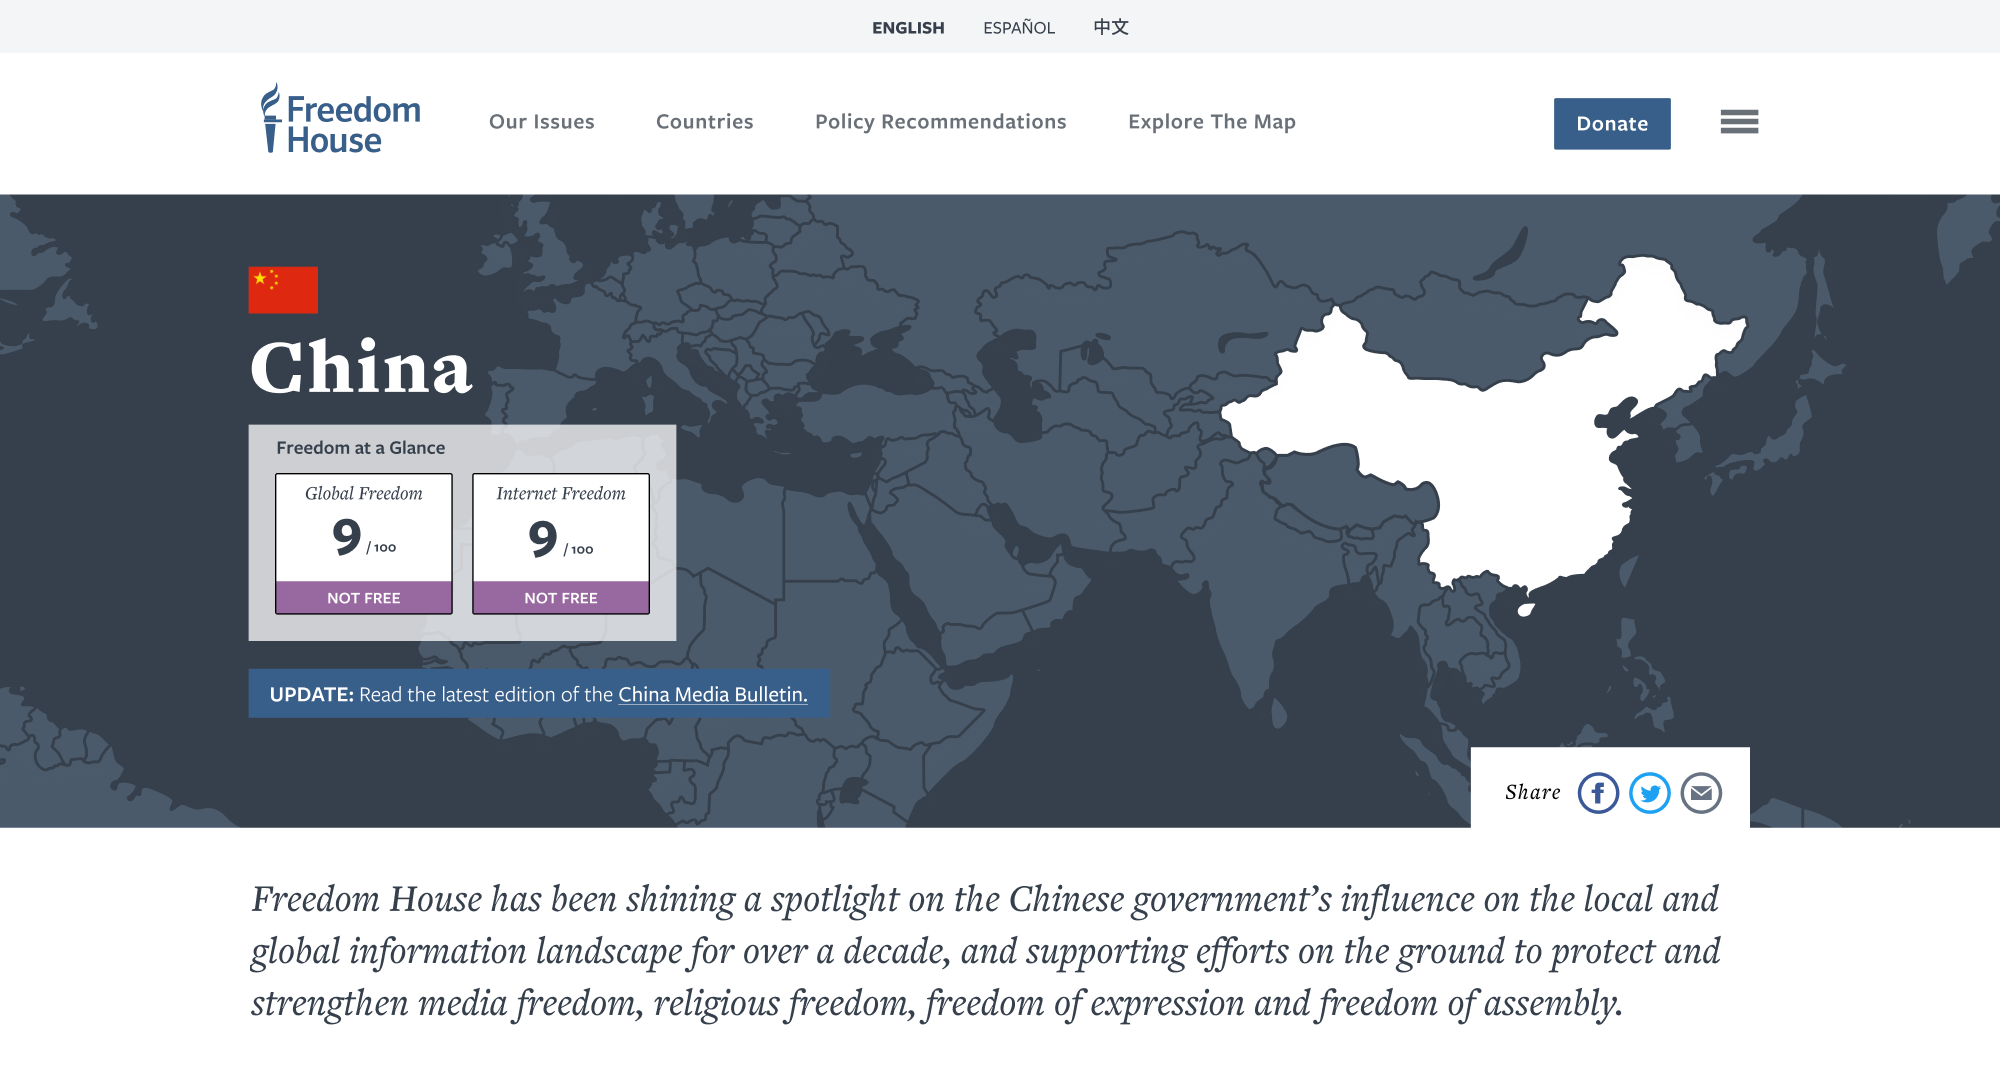
Freedom House needed to translate the first-ever report on Transnational Repression, a complex and far reaching issue, into a clear and compelling digital experience.
The report itself consisted of dozens of components, including country cases, a map experience, individual stories, data sheets, and an in-depth, 10,000 word publication.
Instead of focusing on all report components, we decided to focus on a single, unique page that would tell the story of Transnational Repression and be incredibly shareable. Media outlets would be able to send readers to the report. Those readers would be able to share the report knowing that the concept would be immediately understood. And, through a strategic integration of freedomhouse.org’s existing content types, policy experts and government representatives could still dive into the details and tailor new approaches to address the scope of the problem.
After launch, Freedom House saw that the Transnational Repression site received an average of 3:30 minutes time on page compared to 1:57 minutes sitewide. It also received an increase in backlink traction from all major media outlets, including NPR, New Yorker, New York Times, Washington Post, Atlantic, Foreign Affairs and was a 2021 Webby Award Honoree.
Ongoing Support: Freedom in the World map revamp.
In 2025, we set out to give the Freedom in the World map a refresh.
The previous map focused on the 3 flagship reports — Freedom in the World, Freedom on the Net, and Nations in Transit. Given the fact that the map is Freedom House’s most viewed page by a factor of 5, we wanted to upgrade it to give a more interconnected view of Freedom House’s work.
The new map incorporates blog posts, additional contextual information about each country, a longitudinal view of scores over time, and clearer pathways to different pages, in addition to the report content.
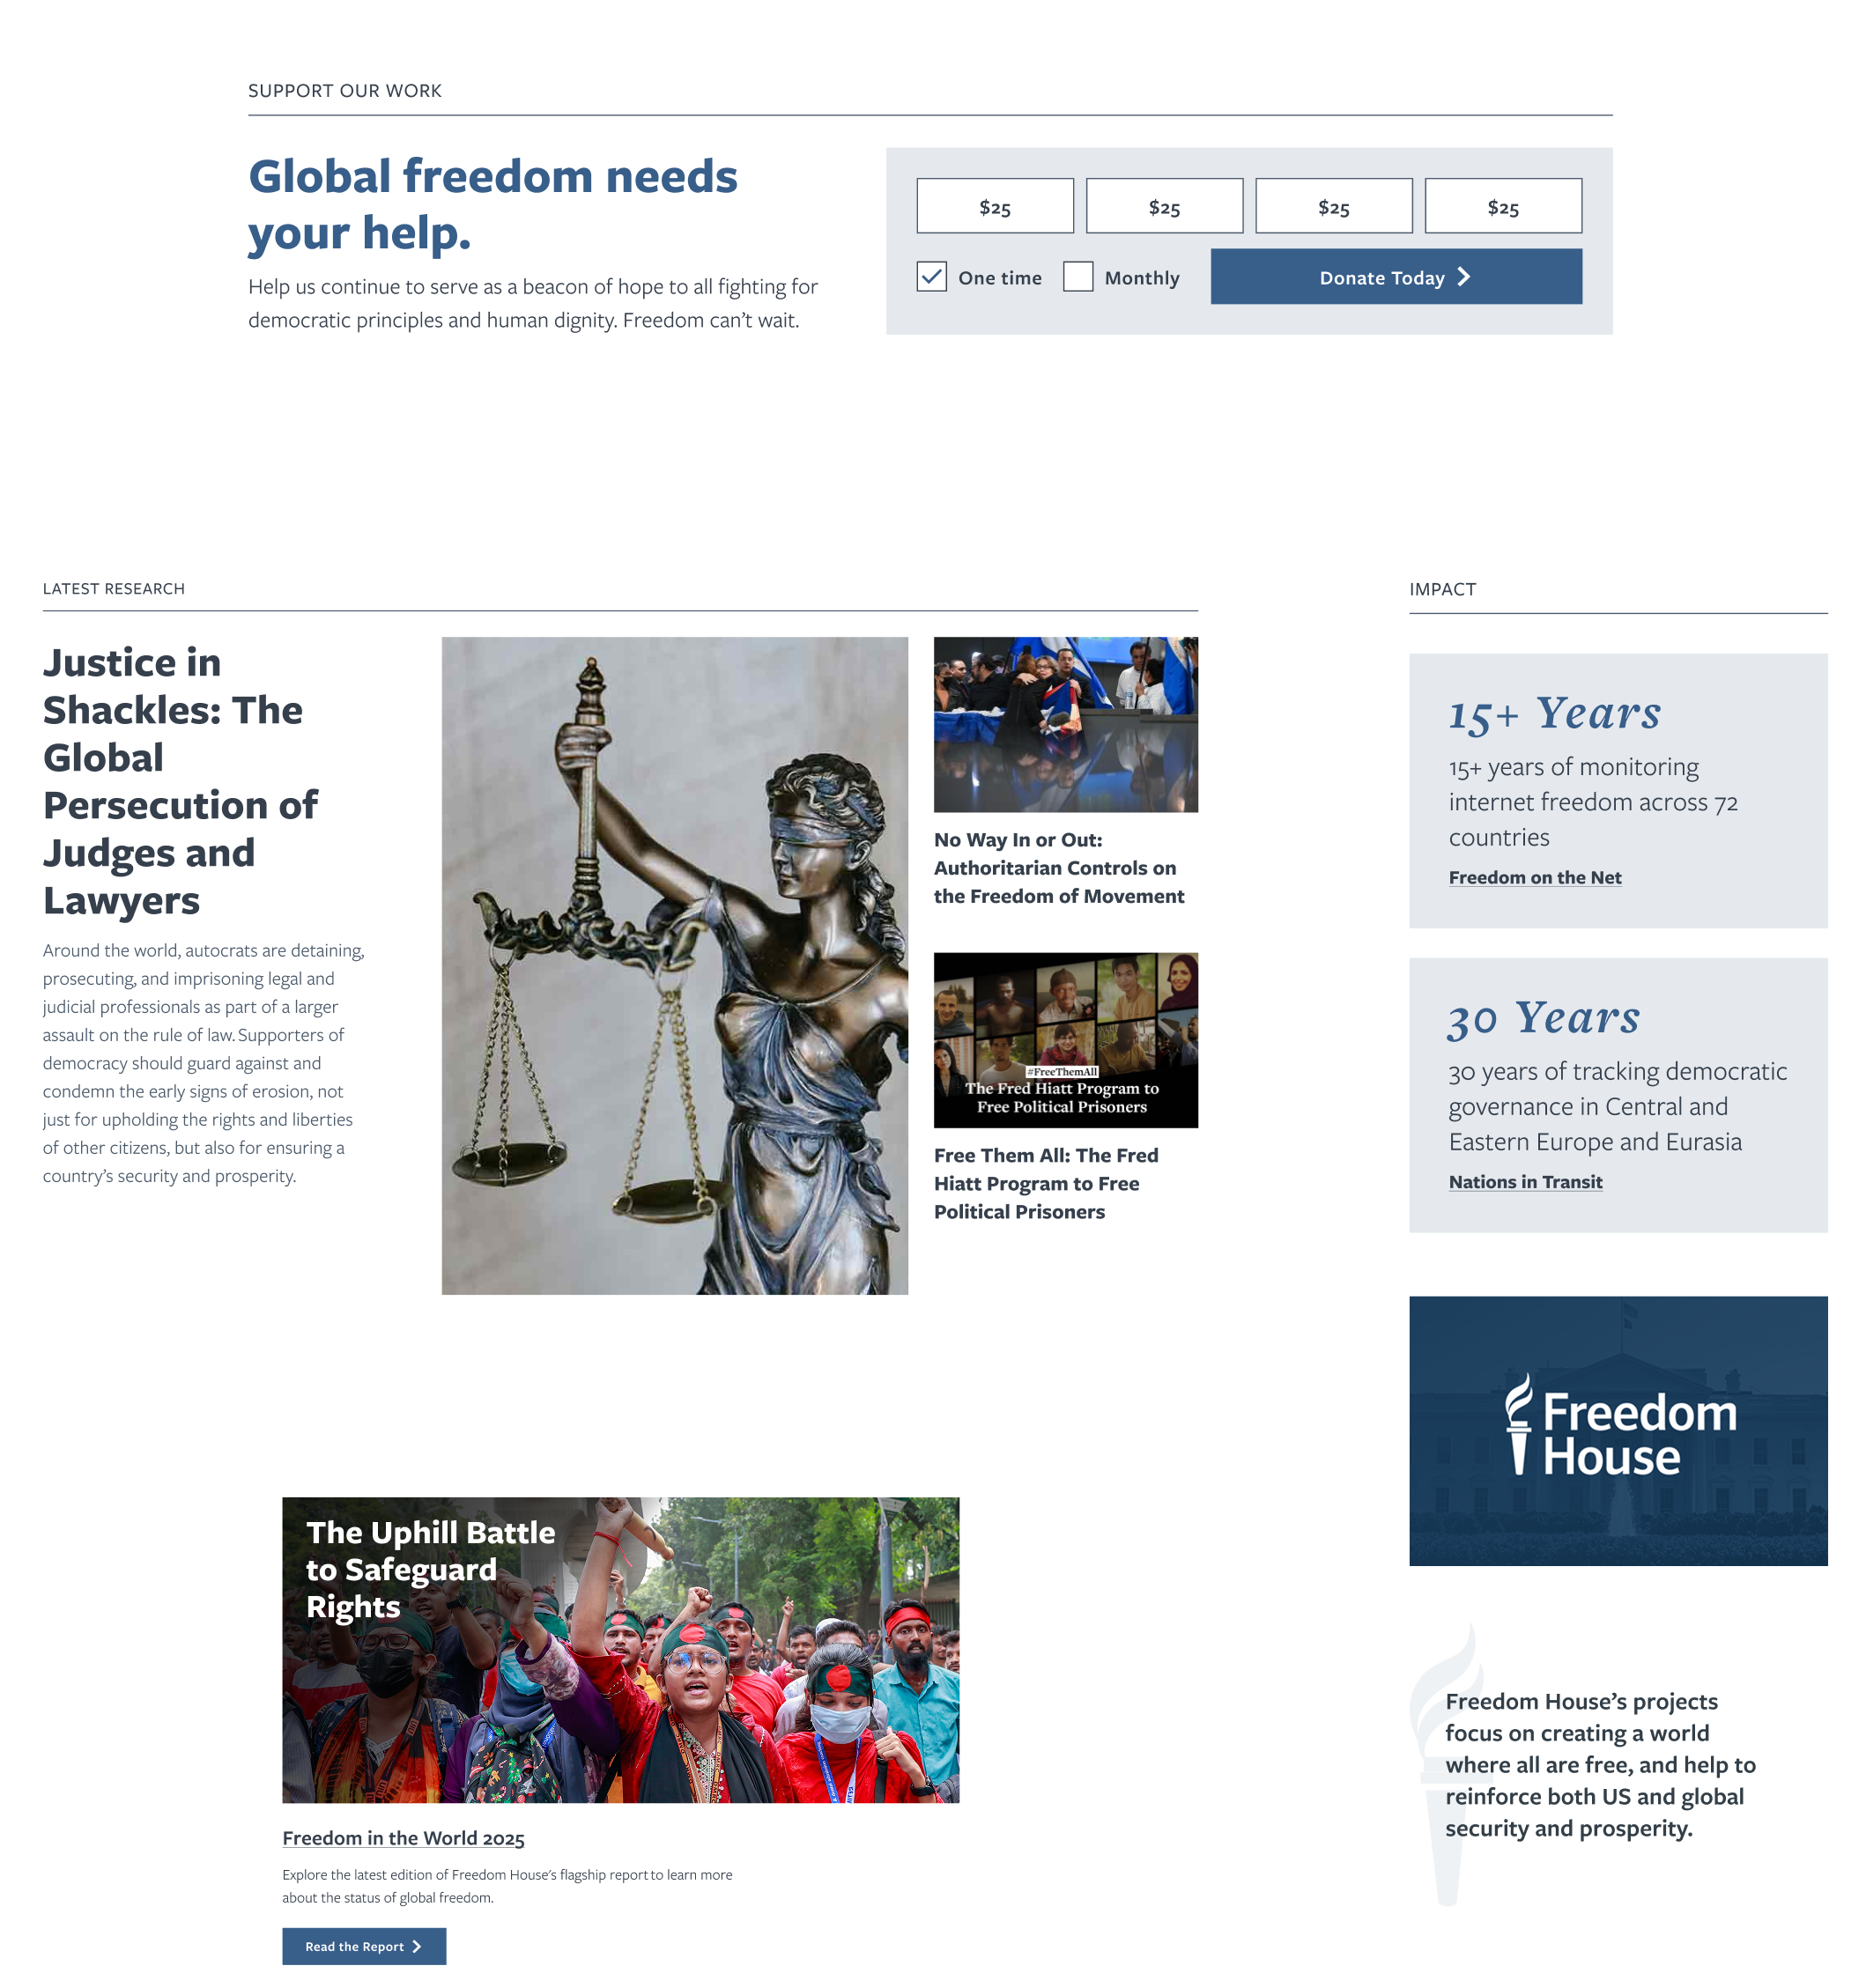
Ongoing Support: Refreshing the homepage.
To support the shift toward a more diverse content strategy, we redesigned the homepage to prioritize storytelling. By highlighting a broader array of timely content, the new layout is designed to engage both new and existing donors, explicitly linking Freedom House’s boots-on-the-ground work with their fundraising objectives.
Results
So far, we’ve had great results with the recent redesigns. Specific to the redesigned map, in a 3-month period year over year, we’ve seen:
- +91% map interactions
- +8% active users
- +300% country data interactions
Explore More